Impact of Proteins

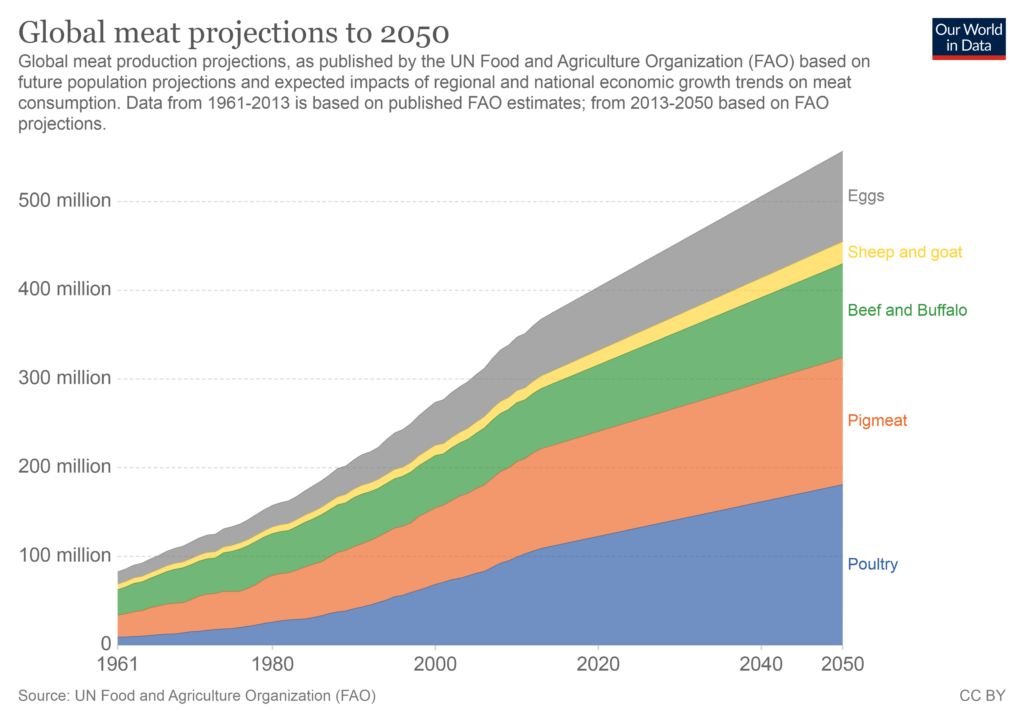
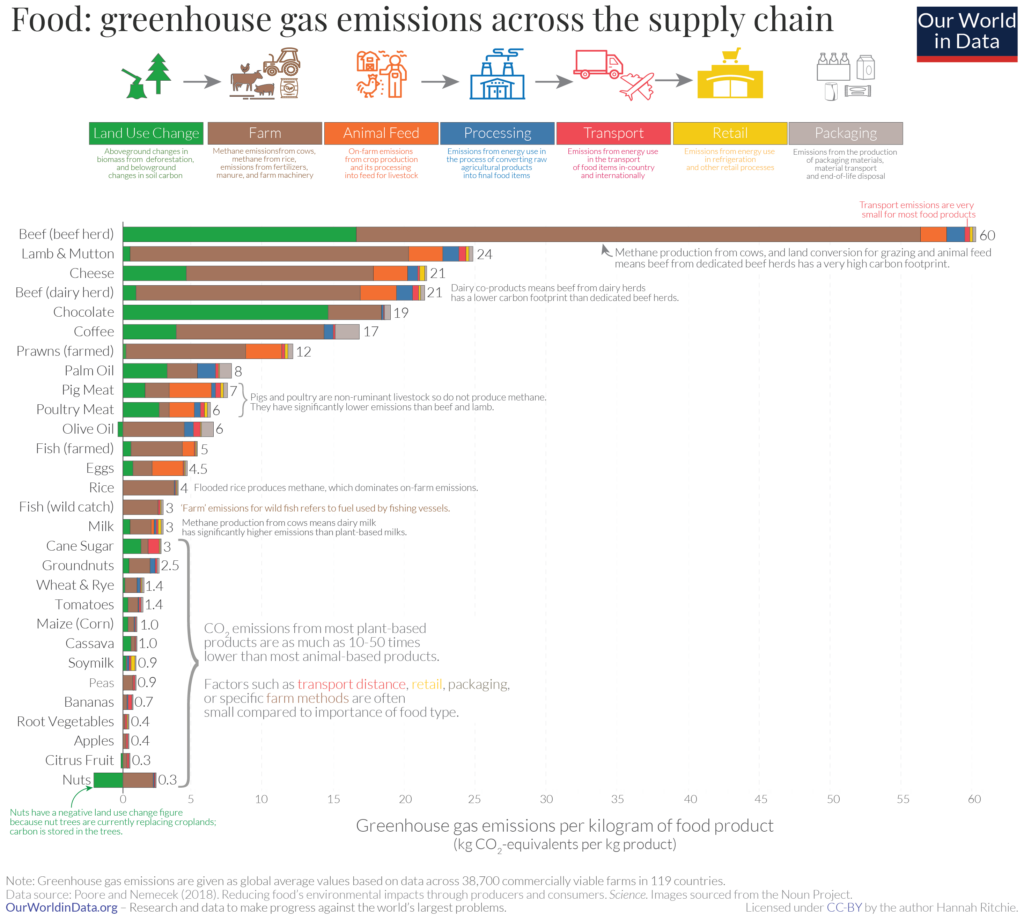
Proteins are one of the most important macronutrients needed for our body. The worldwide demand for protein in 2018 was about 200 million ton/year and estimated to reach 275 million ton/year by 2030. Most of this increased demand in food protein is due to changing diet patterns and increasing population. Analysing the current trend of global protein growth, it is estimated that much of the future demand of protein will come from animal sources whose production has a very negative effect on the planet. The production of proteins from animal sources is a very inefficient and resource-intensive process.

Today Approximately 40% of the total global protein supply comes from animal sources. Among countries there can be seen a huge variation in the supply ratio of the animal/plant protein. For eg in 2017 the protein supply from animal sources to total protein supply was only 20% in India which has a huge vegetarian population but was as high as 63% for the US. But at the same time the demand for animal protein per capita has doubled in the last 50 years in India but has almost remained the same in the US as shown in the graphs (Change country in the interactive graph below).

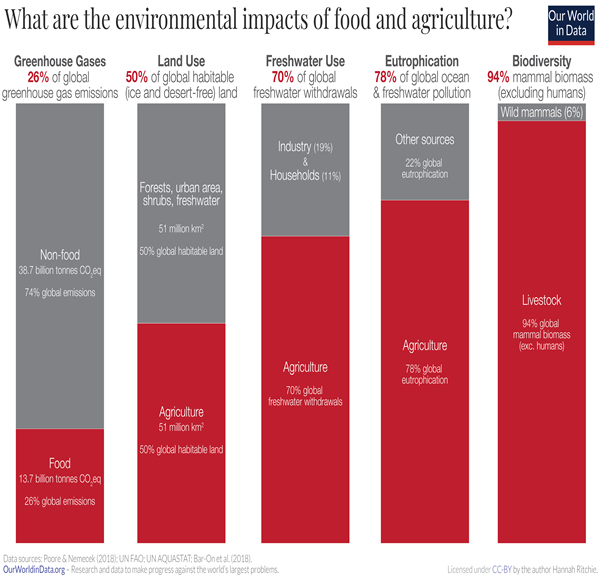
Currently about 11% of the world population is undernourished and various organizations and agencies are working to reduce the same. Together with the growing population and changing diet pattern around the world the demand for protein will certainly go up. Thus there is a serious need to shift the demand from animal source of protein to plant source to make the planet more sustainable. Our aim is to develop food products which can supply protein from plant sources so that it is more sustainable from the point of land use, water consumption, water pollution, CO2eq emission and nutrition. Each is explained briefly below,

Land

As shown in the figure about 148 million km2 of the earth’s surface is covered by land and out of which 71% is considered to be habitable land. Of this habitable land about 50% of the land is used for different agricultural/livestock purposes. Within this land for agricultural purposes about 77% of the land is used for livestock and dairy purposes which include grasslands and farms used to make feedstocks. Thus even though they take such a high percent of land they contribute only 18% of the global calorie supply and 37% of the total protein supply. To put into perspective, to produce one kg of beef it takes 326m2 of land where one kg of pulse needs only 15.5 m2. The figure below shows the land required for different foods produced.

The extensive use of land has also caused reduction in forest coverage and today almost 94% of mammal biomass (excluding humans) is livestock. These livestocks are also the leading cause of desertification and soil degradation. Also of the 28,000 species to be threatened with extinction on the IUCN Red List, agriculture and aquaculture is listed as a threat for 24,000 of them.

CO2 Emission

Food production is responsible for 26% of the world’s greenhouse gas (GHG) emissions. Out of this nearly 60% of GHG comes from animal sources even though they only contribute 18% of the calorie. The difference is very huge in different food stuff. To produce one Kg of beef it emits 60 kilograms of greenhouse gases (CO2-equivalents), While peas emits just 1 kilogram per kg. Overall, animal-based foods tend to have a higher footprint than plant-based. Among animal protein, beef production is the worst and contributes over a third of the GHG emission from animal agriculture. This is followed by Lamb and cheese production where both emit more than 20 kilograms CO2-equivalents per kilogram of meat. Poultry and pork have lower footprints but are still higher than most plant-based foods, at 6 and 7 kg CO2-equivalents, respectively. The graph below shows the difference in the CO2e emitted per kg of the food and at what stage of its supply chain it is emitted.

As the world Population is projected to increase so is the need for protein sources. Most Of this protein demand is estimated to come from animal sources and thereby cause further increase in the GHG emissions. These GHG emissions are a leading cause of climate change which again have a diverse effect on agriculture from the point of water scarcity, flooding, temperature change etc. Thus there is a serious need to shift the requirement from animal protein to plant based proteins from the point of sustainability.

Water Use

Agriculture accounts on average about 70% of the global freshwater withdrawal. This withdrawal percent varies among countries depending on the GDP per capita of the country. Countries with lower per capita usually spend a higher Percent of the water resource on agriculture compared with higher per capita countries. Also among different foods the water requirements vary significantly. It is seen that on average a third of global water withdrawal is used in the meat and dairy industry. The graphs show the global average water requirement for the production of one tonne of product and per 100 gram of protein. From the graph it can be seen that to produce one Kg of beef it take four times more water than pulses and when calculated for equal units of protein the water requirement is over five times than that for pulses. In general it takes a lot more water to make one unit of animal protein when compared to plant protein. This water footprint shown in the graphs is the sum of water requirements across the full value chain (for example, the requirement of meat production includes the water requirement of the animal as well as the demand of the crops grown for animal feed). This value also includes the quantity of wastewater or water which is polluted as a result of agricultural production.

Due to the projected growth in the demand for protein due to various geo-political reasons the demand for animal protein will certainly increase. This is going to add more pressure on the fresh water availability which is on a decline. Thus there is a serious need to shift the demand from animal protein to plant protein from the point of water consumption. Else the desertification of certain parts of the planet will be unavoidable affecting the livelihood of millions of people.

Eutrophication

Eutrophication is the pollution of the water bodies as a result of excessive nutrients mainly, nitrogen and phosphorus in it. These nutrients stimulate the excessive growth of algae/plant/plankton species that cause reduction of oxygen and sunlight in the water bodies and thereby affect the fish and other marine animals. The runoff of nitrogen and other nutrients from agricultural/cattle/fish farms is a leading contributor to this nutrient imbalance in water bodies. The eutrophying emissions of foods is quantified as grams of phosphate equivalents (gPO₄eq). Eutrophication is a major environmental problem and the gPO₄eq emission for different food production is shown in the graph. From the graph the negative impact of animal protein is very evident.

Nutrition 

Different foods have different protein content and the quality of the protein is different in each. The quality of a Protein source is dependent on the ratio of the essential amino acids to a reference table and its overall digestibility. This protein quality is quantified by a term called PDCAAS (Protein Digestibility corrected amino acid score) which has a value between 0 and 1. A value of 1 denotes its a complete protein and supplies all the required essential amino acids. It is seen that the PDCAAS score is not similar in the protein coming from plant and animal sources. Generally the PDCAAS score is better in animal protein when compared to the plant based proteins as shown in the figure. We intend to design vegan foods that have PDCAAS scores similar to animal proteins. 


Source

PDCAAS

Milk

1

Egg

1

Beef

0.92

Chicken 

0.92

Fish

0.92

Kidney beans

0.68

Peas

0.61-0.68

Peanut

0.52

Lentils

0.51

Whole wheat

0.4

Rolled oats

0.57